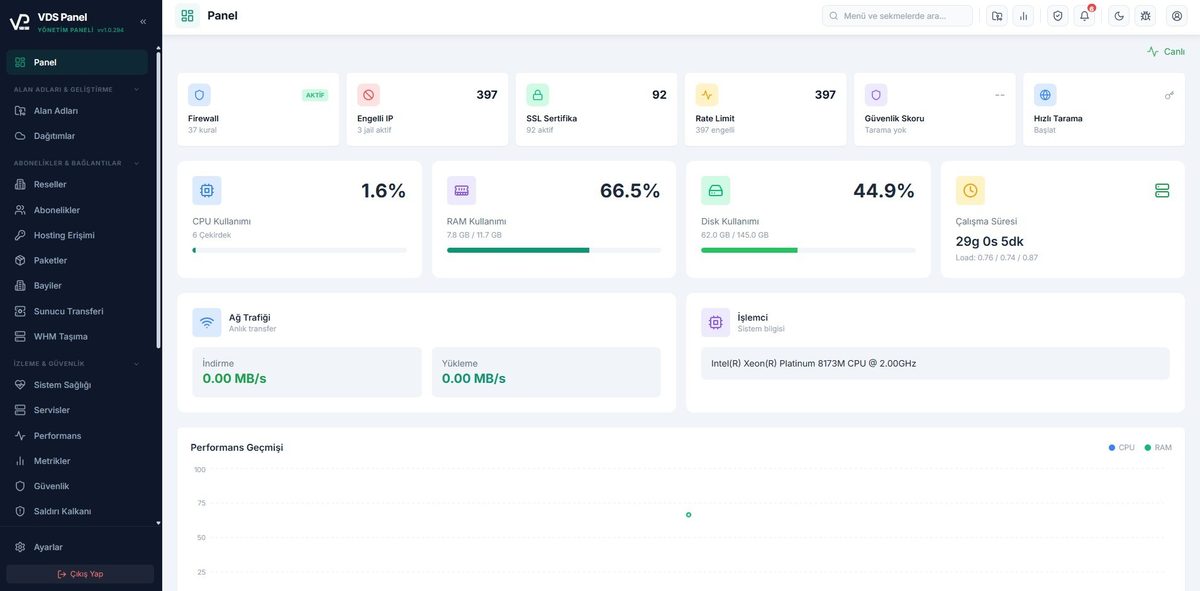
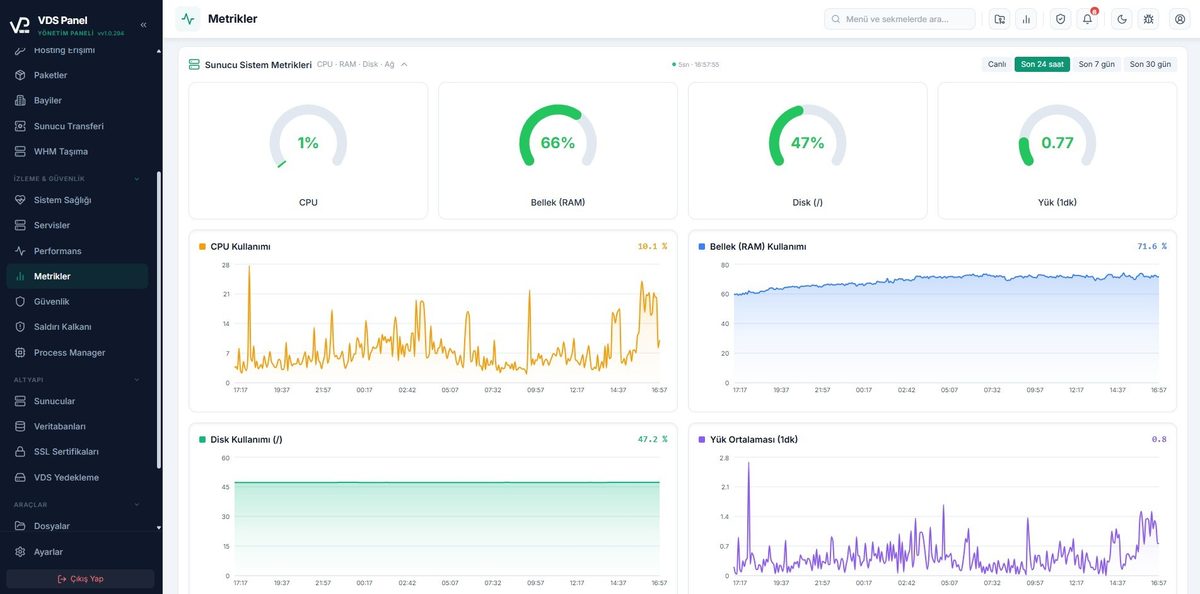
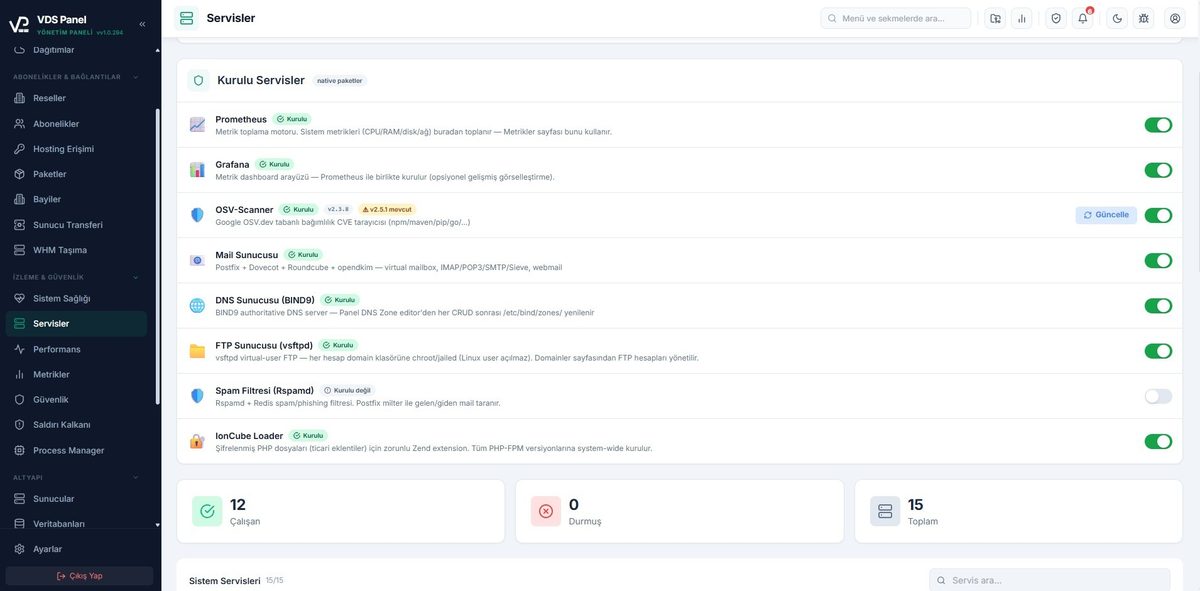
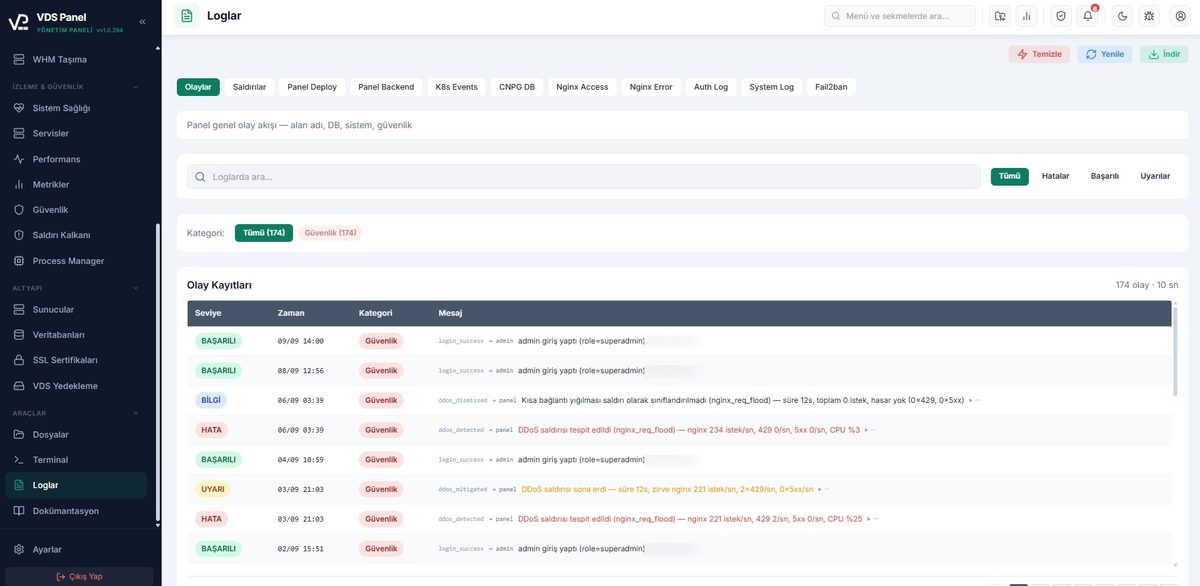
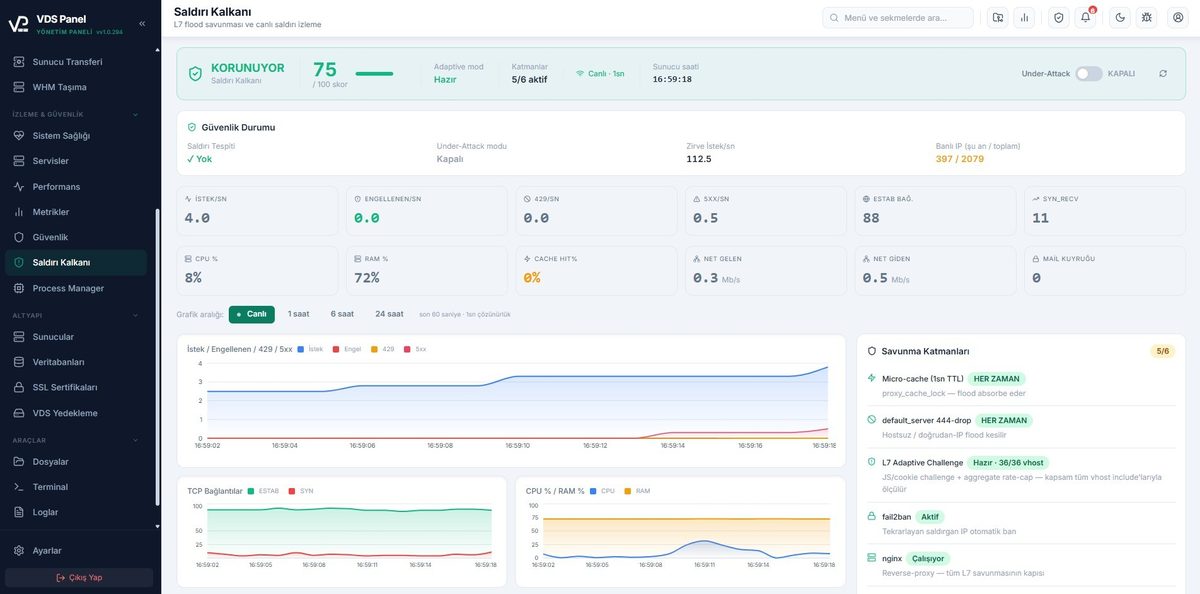
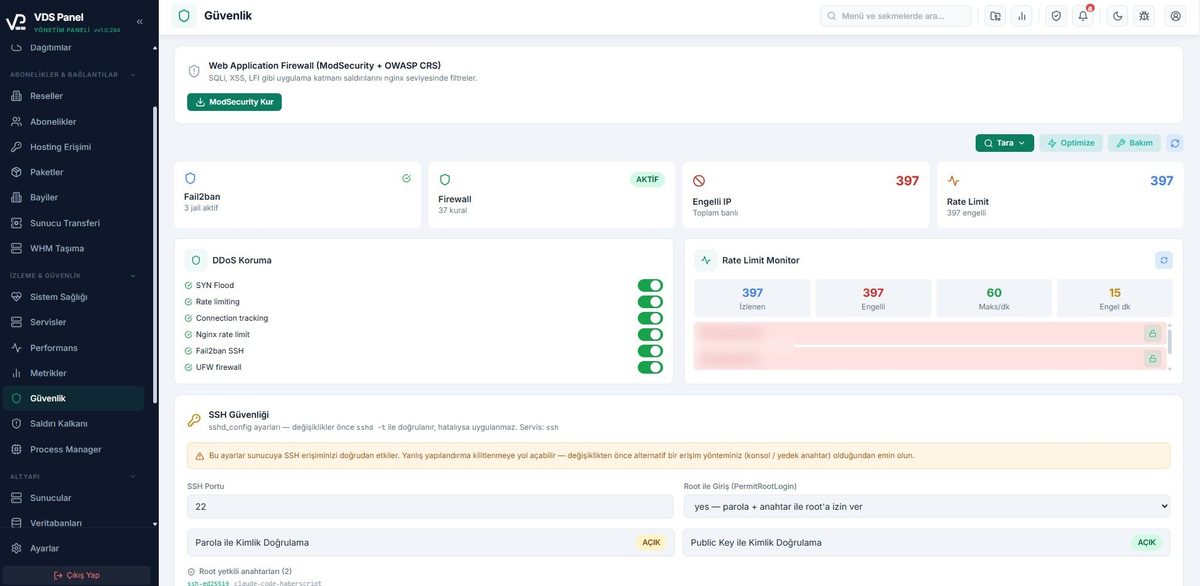
Deploy, monitor and manage, all on your own server. Self-hosted, open control, modular licensing. Java, Node, PHP, Python, Docker and Kubernetes - all in one panel.
Self-hosted
TR & EN support
Modular licence
140+ pentest checks
Modules
- JAR · Spring Boot
- Kubernetes (K3s)
- Automatic Databases
- Mail + DNS + SSL
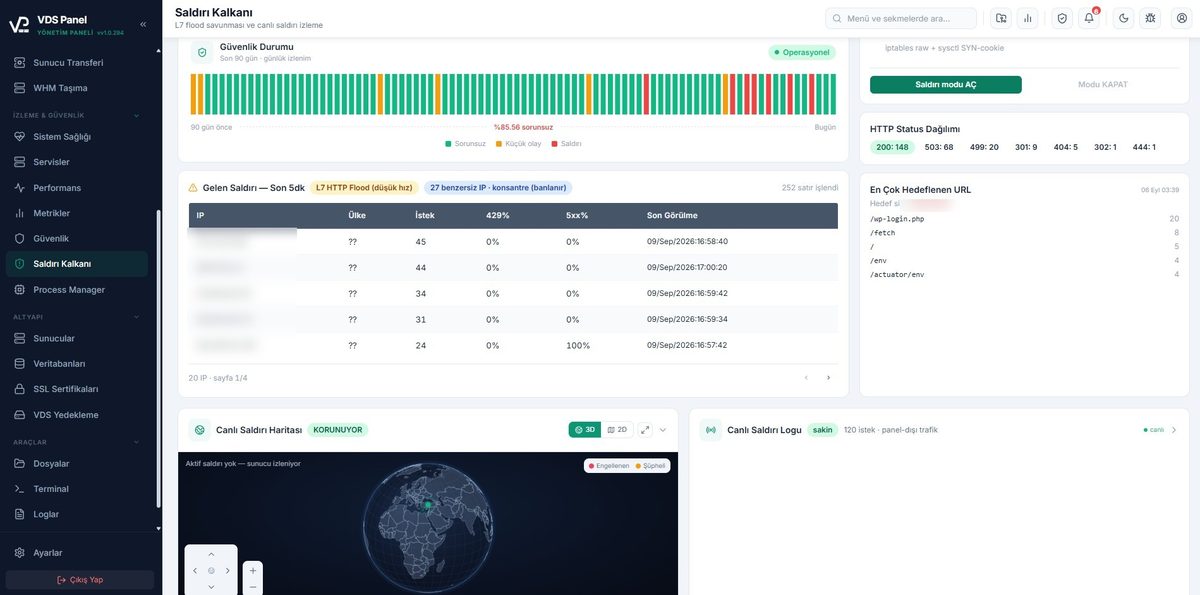
- Attack Shield
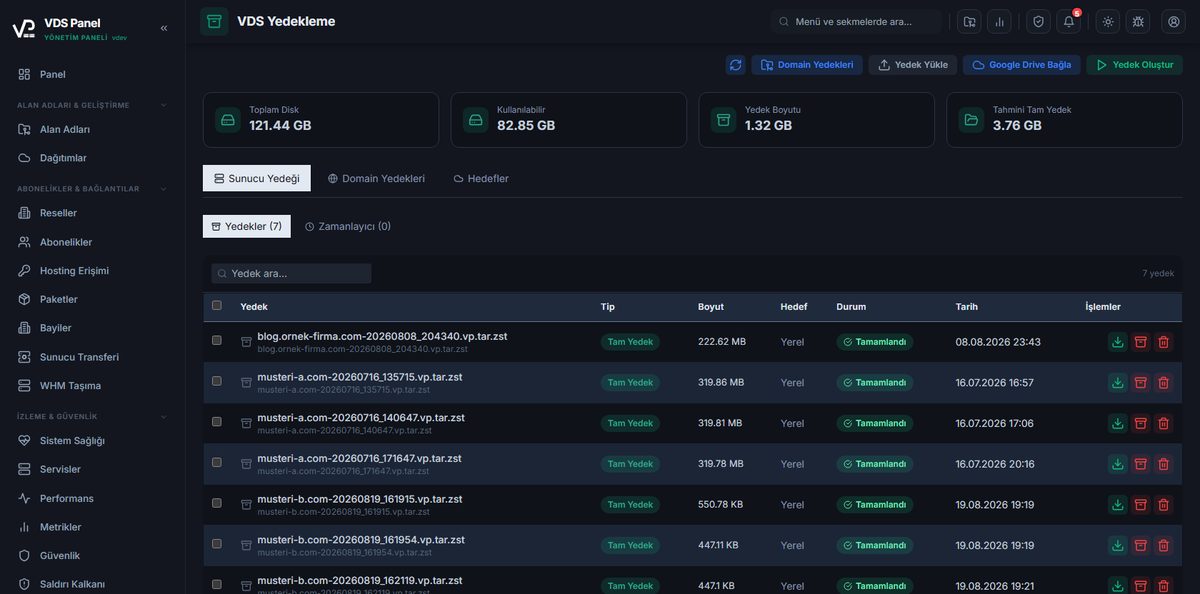
- VDS Backup
Supported stackJava, Node.js, Python, Go, PHP, Ruby, .NET and anything with a Dockerfile.
Spring BootNode.jsPostgreSQLRedisMongoDBK3sDockerNginx